datasette code-frequency chart on GitHub Out of curiosity I decided to see if I could find a useful illustration of the impact of coding agents and Opus 4.5 class models on my own output. The best I've found so far is this GitHub chart of frequency of code changes to my Datasette open source project: The big spike in activity at the end aligns with Opus 4.8, GPT-5.5, Fable 5 and GPT-5.6 Sol. Tags: github, ai, datasette, generative-ai, llms, ai-assisted-programming, coding-agents
datasette code-frequency chart on GitHub
Out of curiosity I decided to see if I could find a useful illustration of the impact of coding agents and Opus 4.5 class models on my own output. The best I've found so far is this GitHub chart of frequency of code changes to my
Datasette open source project:
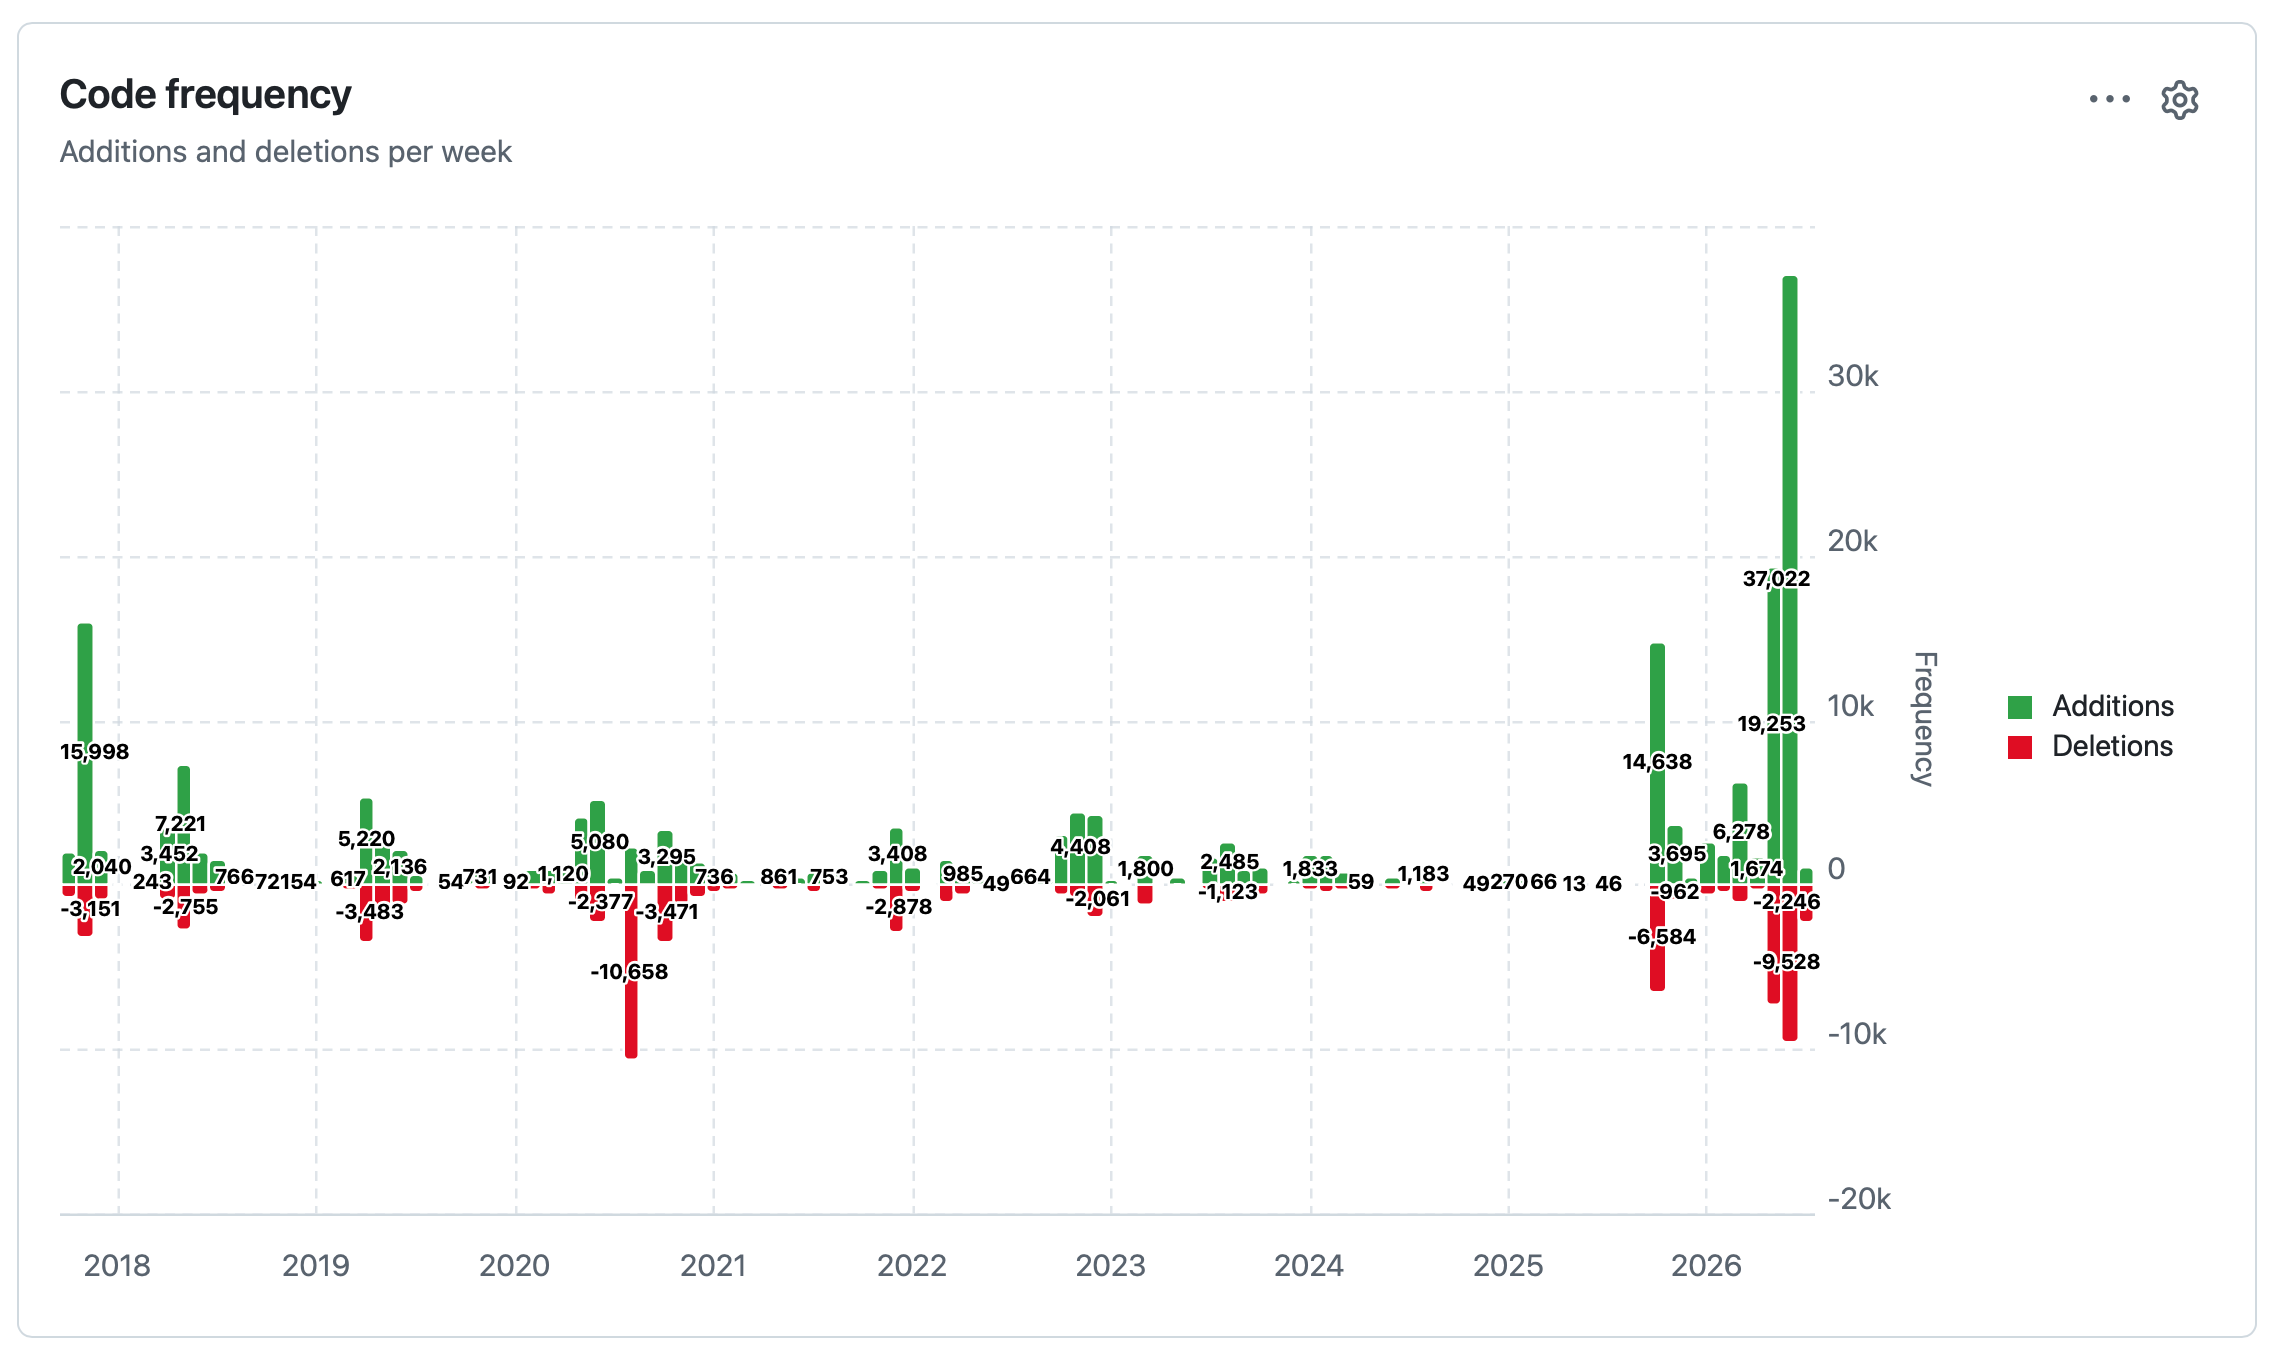
The big spike in activity at the end aligns with Opus 4.8, GPT-5.5, Fable 5 and GPT-5.6 Sol.
Tags: github, ai, datasette, generative-ai, llms, ai-assisted-programming, coding-agents